POWERED VFR FLIGHT · ALPS
Weather, terrain and airspace along your route.
Draw a VFR route. Compare wind, clouds and terrain at the estimated passages. Examine the proposed altitudes and the points that need attention.
Open the map Base map without an account Explore the example plan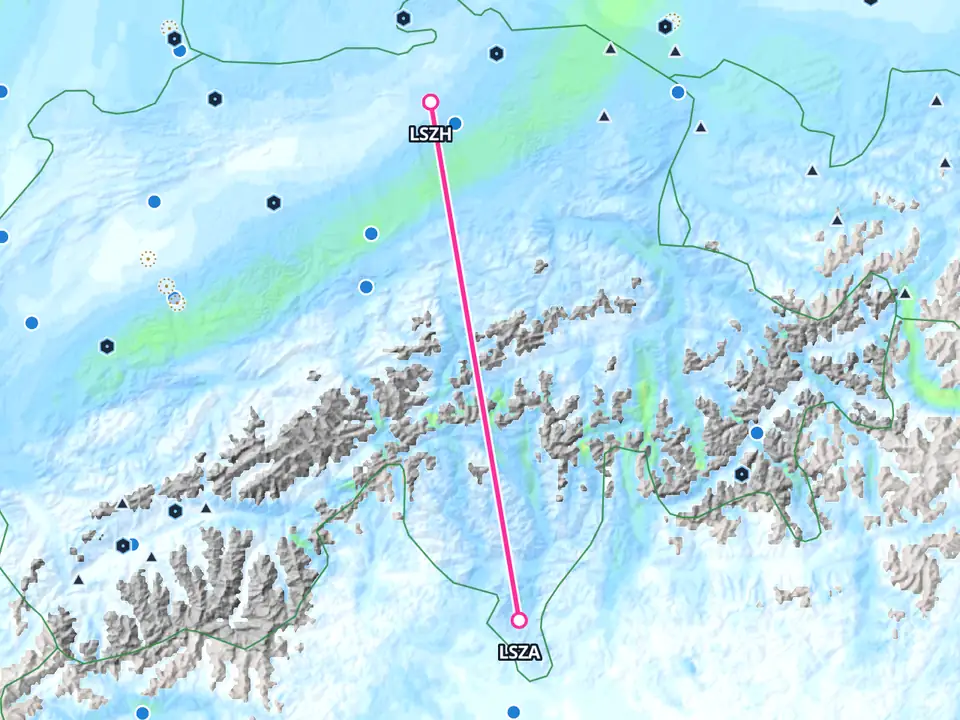 65 NM · the plan passes through the forecast cloud layer
READ THE WIND
Wind changes with the terrain.
Compare the same point, at the same time and altitude.
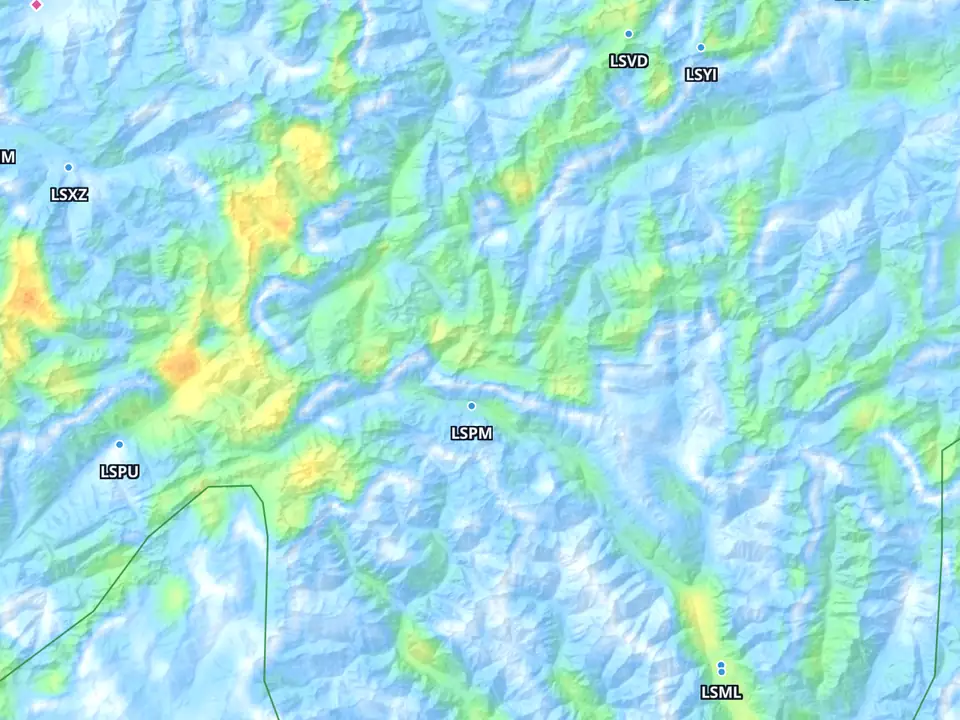 Base modelTerrain detail20 km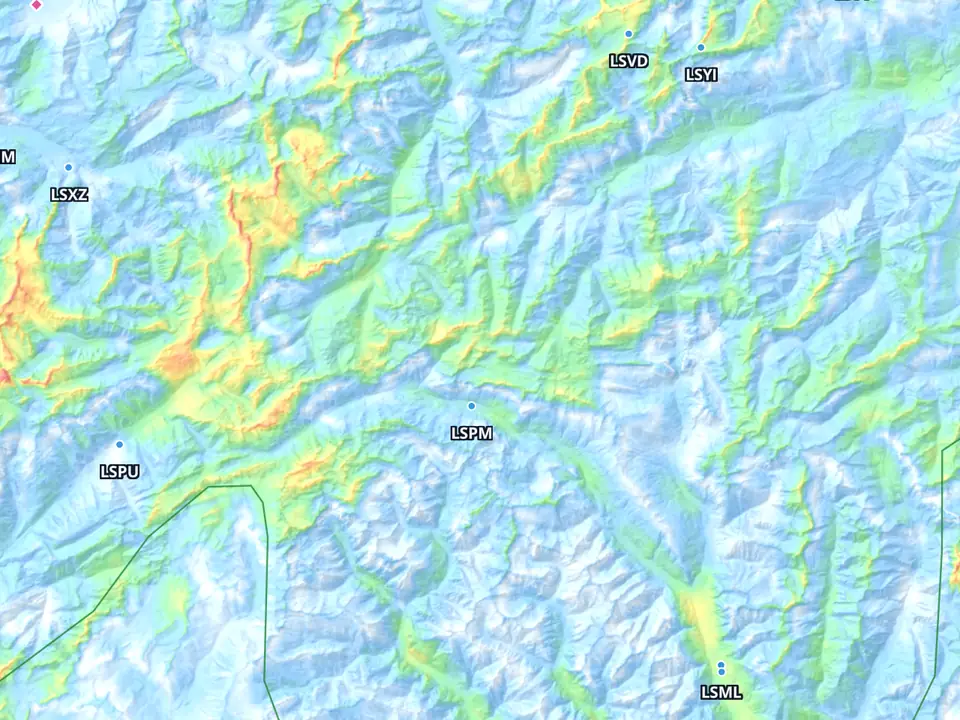
Point A: base model 6 kt · terrain detail 15 kt
Same place · 12:00 UTC · field at 350 ft above ground
Down to about 100 m of spatial detail over the terrain, where available.
Central Alps around Ambrì · 5 October 2026 · ICON-CH, 06:00 UTC run · colours show speed, same scale in both states
Method and limits
The two images are app captures with the same frame, time, level and colour scale. The values at point A are read from the app's wind field in the two states, rounded to the knot; A is the point where the two fields differ most in this frame. The ICON-CH wind is adapted to the terrain with a local model. 100 m is the detail of the representation: it is neither the flight height nor a guaranteed accuracy. Resolution, coverage and result depend on the data and version available; the field is not a validated forecast of rotors or lee shelter.
Change altitude. Read the difference.
You change the wind map. The plan stays at 09:00 UTC.
Compare the time too · 09:00 UTC
- Fixed reference
- Selection
- 8'200 ft AMSL · 09:00 UTC · average 4 kt
Choose another altitude to compare.
Samples and peak
Selection: peak 6 kt, 30 of 31 points available.
Example of 5 October 2026 · altitudes above mean sea level (AMSL) · wind in kt
Method and limits
ICON-CH, 03:00 UTC run. The values summarise the wind at the available points along this route, at the time and altitude shown. Where the level cuts through the terrain the value is missing: it is not zero wind. Average and peak are values of the samples; averages over a different number of points are not a perfectly controlled comparison. The reference stays the initial state until you reset the example.
READ THE PLAN
Read the route, point by point.
Compare plan altitude, terrain and clouds at the estimated passage.
Zurich–Lugano · 89 NM · departure 09:00 · estimated arrival 09:47 UTC · recorded example of 5 October 2026
2 factors to look into · 1 value not available
Model result for this plan: NO-GO.Data not available (1)
Relative turbulence indicator: not available in this example. It means this assessment is missing, not that the phenomenon is absent.
All factors
No issue found in the assessed data for: precipitation, wind aloft, icing (estimate), runway crosswind, density altitude.
Show on the map

Here the plan enters the forecast cloud layer.
How do I read this?
Pick a sign: the chart highlights it and here you read what it shows.
terrain under the routeridges within ±5 NMmid-level cloudlow cloudcumulusairspaceplan altitude at the pointbase in the sample
Airspace and layers
ICON-CH, 03:00 UTC run · altitudes in ft AMSL, distances in NM
Method and limits
The solid shape shows the terrain under the track; the dashed line the ridges within ±5 NM, sampled every 6 NM. The terrain used by the profile has a detail of about 1 km: it is not the detail of the fine wind. The cloud curve is smoothed over five points, as in the app: at the critical point it runs at about 8,700 ft, while the analysis uses the sample at the point, about 8,200 ft, with a forecast cover of 100 % and a top around 12,500 ft. The roughly 800 ft between plan and base is the difference of the two values: not cloud-free space. What is shown is the plan altitude at the alert point, not the whole sequence of altitudes; the passage time appears only where the example records it. The plan proposes altitudes and estimates the passages with the available data and the parameters set; deviations proposed by the app must be examined, they are neither a guaranteed route nor a clearance. Airspace: open flightmaps, sampled every 6 NM; the scale stops at 15,000 ft.
Analysis based on model data. It replaces neither the official briefing nor the pilot's decision.
How much do the forecasts vary?
In the ensemble, about 5 of 20 members give a ceiling below 3,300 ft above ground (1,000 m threshold, count reconstructed and rounded). The app places this value around 24 NM from Zurich: that is not the alert point at 65 NM. It is a specific weather event, not the probability that the flight is safe. The ceiling above ground (AGL) and the cloud base above mean sea level (AMSL) have different references.
Compare another departure in the app.
Change the time or examine a proposed deviation. Recompute the plan to see what changes and which issues remain.
COMPARE THE SOURCES
Put forecast and observations side by side.
Each value has its own place and time.
ForecastAlpine stretch · passage 09:34 UTC
Base of the mid-level layer: about 8,200 ft AMSL, 65 NM from Zurich.
ObservedAirport METARs · 07:50 UTC
The METARs describe the airports, at places and times different from the Alpine stretch.
Departure · Zurich LSZH · 70 minutes before departure
- wind
- variable, 3 kt
- visibility
- 10 km or more
- clouds
- few at 7,500 ft above the field (≈ 8,900 ft AMSL)
Arrival · Lugano LSZA · almost 2 hours before arrival
- wind
- variable, 2 kt
- visibility
- 10 km or more
- clouds
- few at 6,000 ft above the field (≈ 6,900 ft AMSL)
Observations along the route
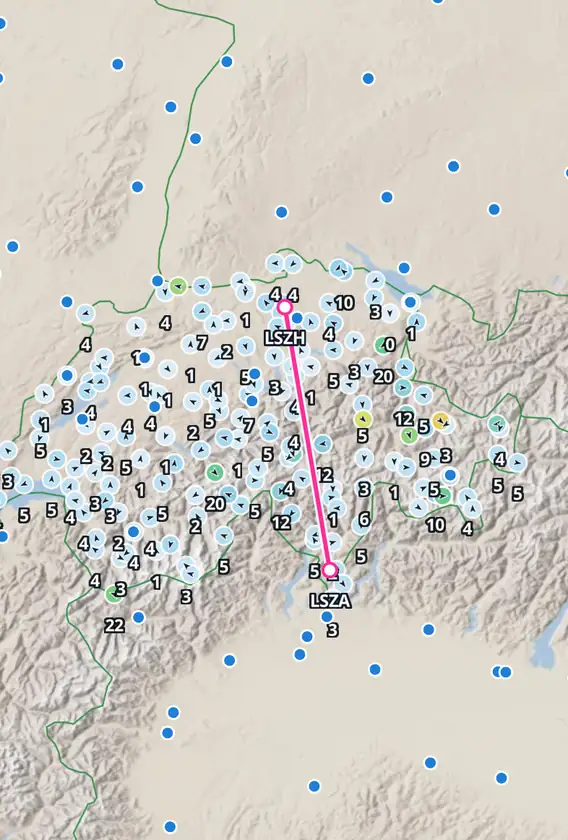
METAR: NOAA Aviation Weather Center · stations and radar: MeteoSwiss. Observations recorded for this example, not live data.
TOOLS
Look deeper into the weather at the point.

Recorded app screenshots, 4 Oct 2026: the buttons inside the image are not active.
Export the route and save an area in the app.
Exports
Flight sheet as a PNG image, with map, legs and profile; route to SkyDemon, GPX or FPL. Importing altitudes and other details depends on the format and on the receiving app.
You save the area and the selected data of the run. Without a network you can consult them, but observations and forecasts do not update.
Other tools

Clouds by layer, precipitation, CAPE, vertical wind and the 0 °C isotherm: open the relevant value when a stretch needs a closer reading.
Airspace, GAFOR routes and Swiss VAC procedures help you read the context of the route, with stated sources and limits.
The GAFOR weather statuses shown by the app are estimated from the forecast and the available METARs. Consult the official bulletin separately.
Set the TAS cruise speed and the crosswind limit. They are parameters of the calculation, not a full performance model of your aircraft.
GET STARTED
Try it with your route.
Right away, without an account
Wind by altitude, clouds, precipitation and temperature. Two-day forecast.
Open the mapWith your email
Get the route tools, the proposed altitudes, the wind with terrain detail and the offline maps.
Sign in with your email See access and pricingSources
ICON-CH forecasts from MeteoSwiss; terrain from swisstopo and Copernicus DEM; airspace and procedures from open flightmaps; airports from OurAirports; METARs from the NOAA Aviation Weather Center. Each value must be read with its own update time.
Limits
Troposphere supports preparation with estimates and available data. Visibility and fog are not forecast by the plan analysis. Coverage and updates can vary. Consult the official briefing; the decision remains the pilot's.